Deriving A Data Model From A Design With GraphQL
Data modelling is one of those skills that’s needed at nearly all levels of the software development stack. It covers the full spectrum from information architecture to UI, to APIs, all the way to the underlying database tables. When it’s done well, everyone benefits. Customers can easily form accurate mental models, designers and engineers can work together effectively, and analysts can extract and interpret data in a meaningful way. All of this makes it a useful skill to develop.
In this article, I introduce a fun little exercise I came up with; one that I sometimes use when interviewing candidates. The challenge is to pick a single screen or page from an app or website, and derive as much of its data model as you can. I like to pick popular web apps like Twitter and Reddit. If you’re interviewing someone, and have a suitable example, you could even use your company’s product. For this article, I’m using Dribbble.
Picking a page
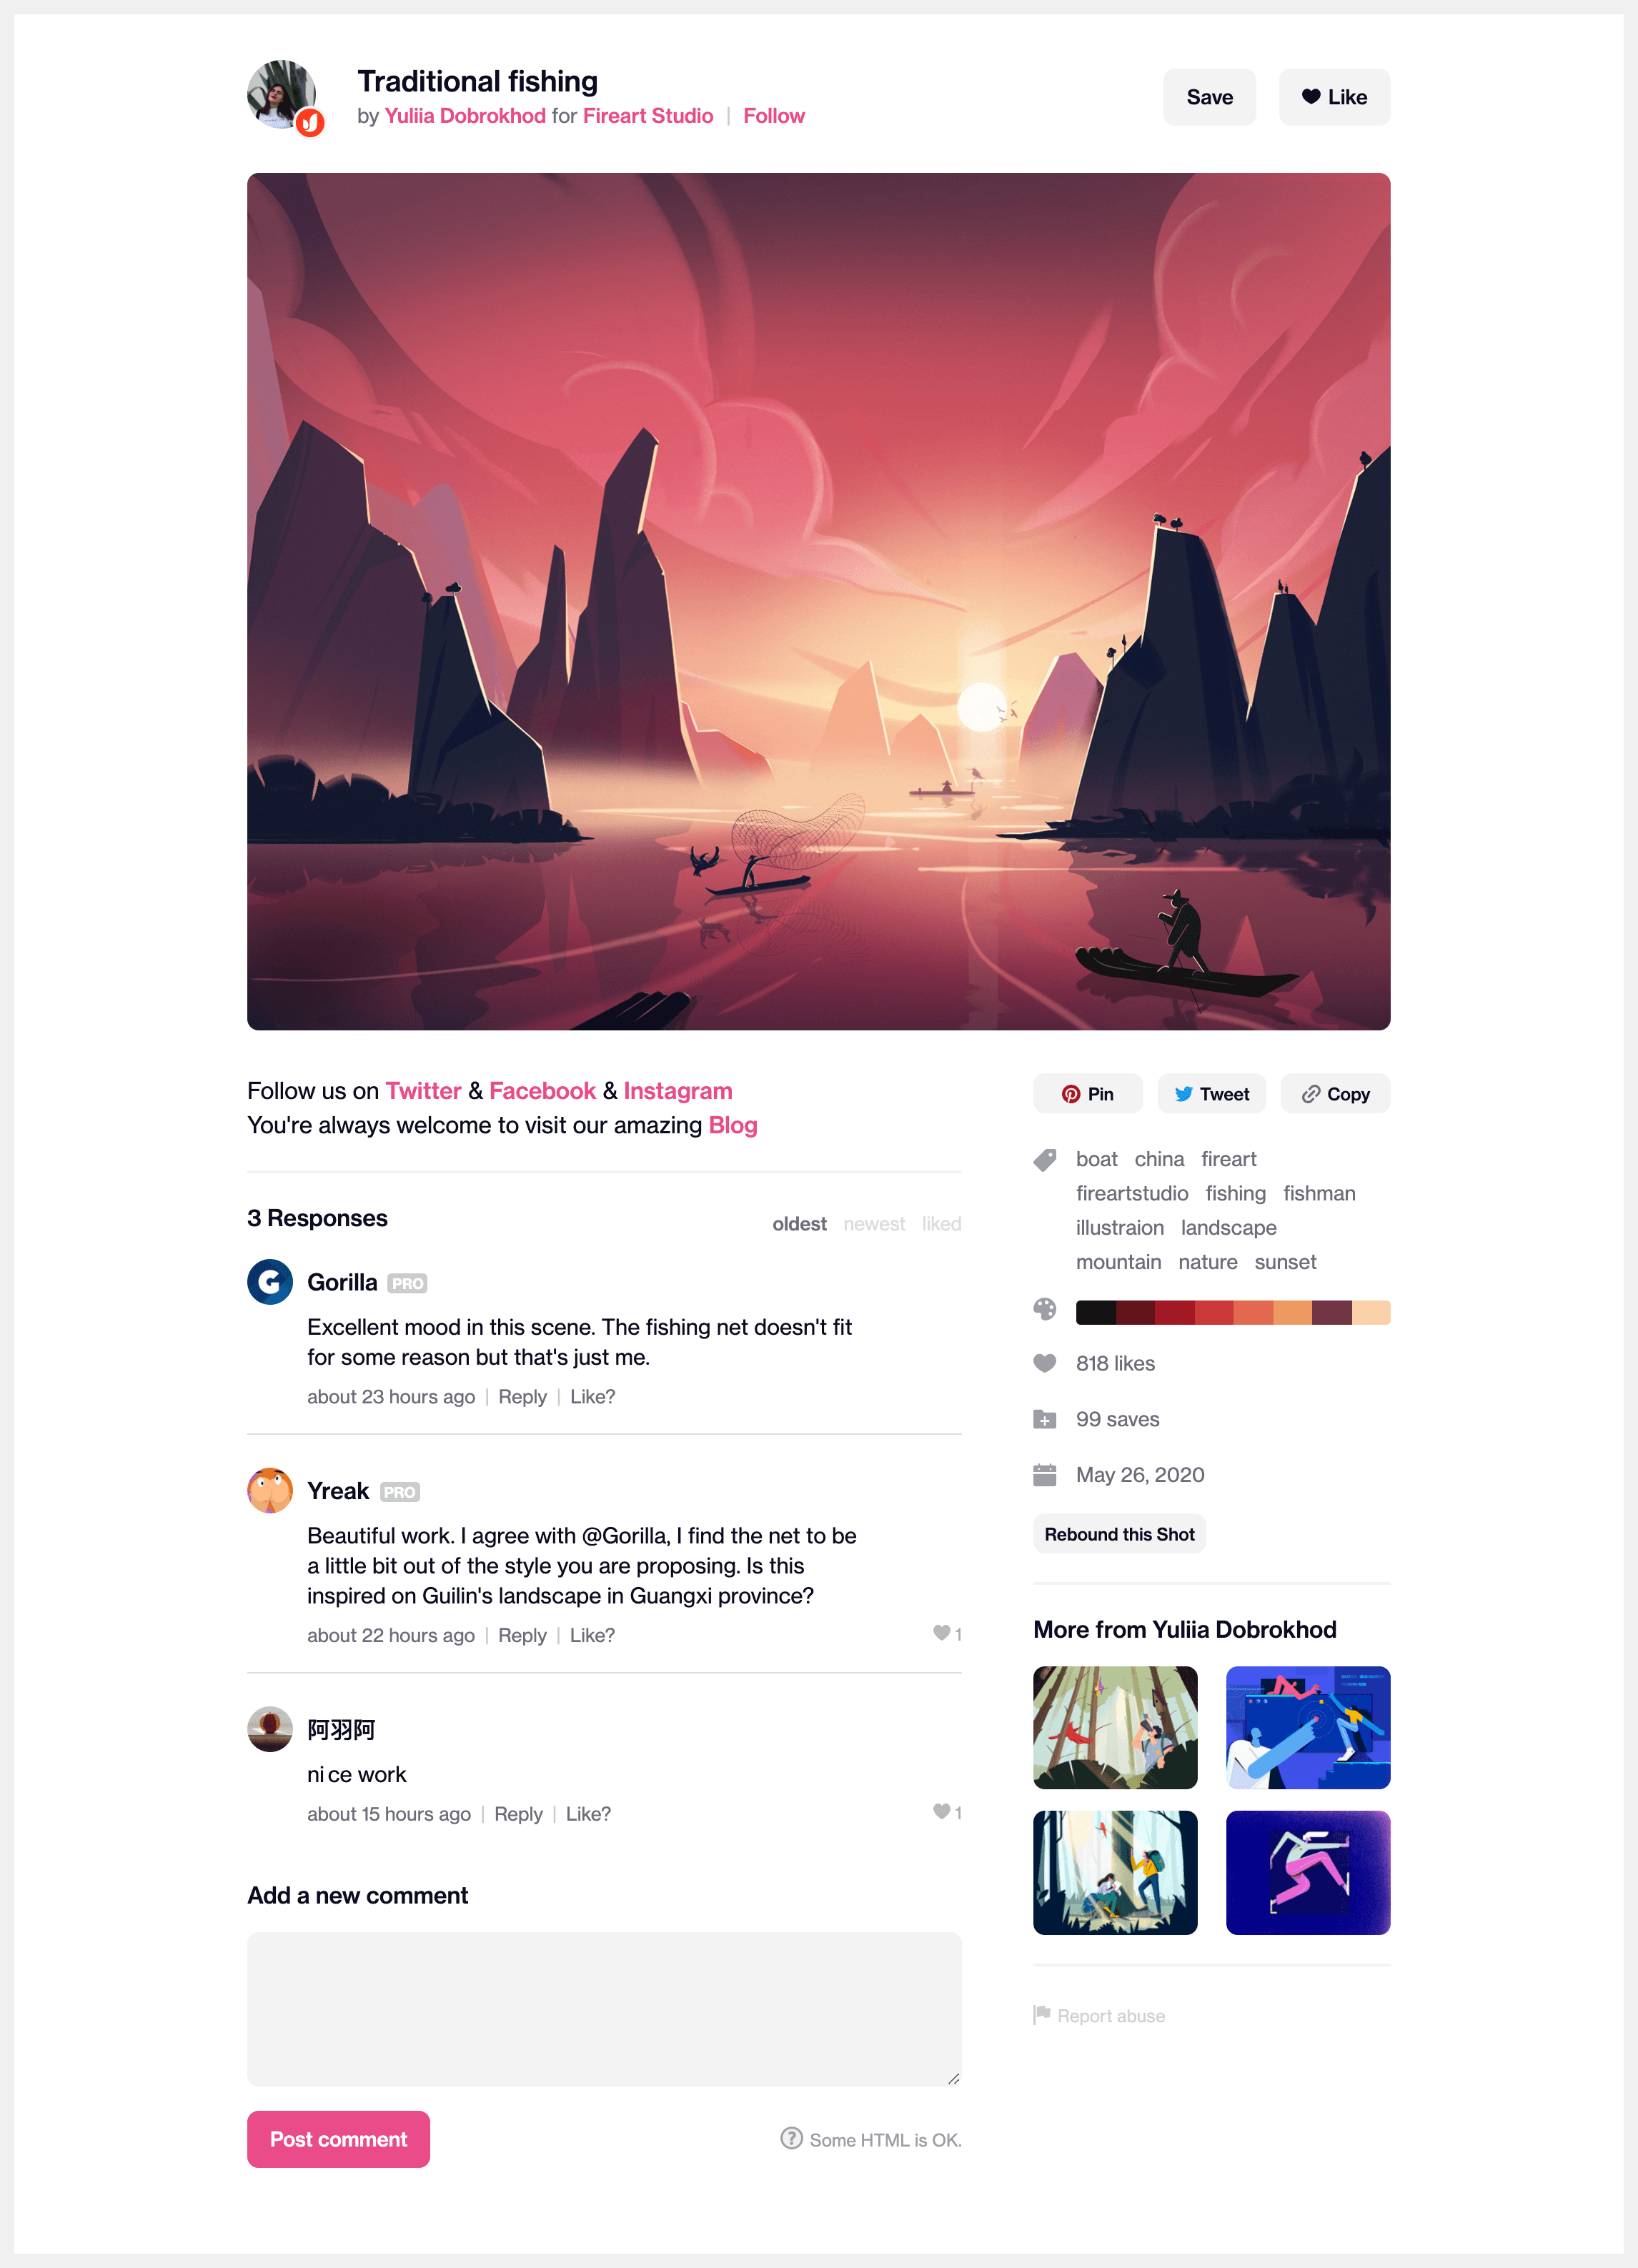
The most suitable page to use is going to vary by product, for Twitter I’ve used the homepage for logged-in users, likewise for Reddit. For Dribbble, I’m going with a Shot page. I’ve picked one more-or-less at random after browsing the site a bit. Like most individual examples, it doesn’t contain every possible element, but that’s not a problem.
There’s more than one way to break down the problem, for this article I’ll tackle it top to bottom.
As a fan of GraphQL, I like to use its Schema Definition Language (SDL) to write down the data model. I’ve found the SDL is a great way to have conversations about data, so it’s become my format of choice. In an interview situation, I wouldn’t impose any constraints as to how someone writes down their solution, as long as I can understand it.
Breaking it down
Starting at the top

Above the main shot image, we can see a few pieces of content. The most obvious is the title of the shot. We can also see who created it (or posted it, if we’re being picky), and who commissioned it, the latter of which I know to be optional. There are two avatar images, with the creator being the larger image, and the commissioner being the smaller of the two. There are also buttons for following the creator, saving the shot, and liking the shot. The state of these buttons changes depending on whether the viewing user has their respective actions already.
So we already have a few entities at play: the shot, the creator and the commissioner, as well as a few fields on each of them. For the sake of simplicity, I’ll assume the creator and commissioner are represented by the same type of entity, let’s call it a User.
type User {
  id: ID!
  name: String!
  avatar: Image!
  viewerHasFollowed: Boolean!
}

type Shot {
  id: ID!
  title: String!
  createdBy: User!
  commissionedBy: User
  viewerHasLiked: Boolean!
  viewerHasSaved: Boolean!
}
The viewer terminology in the above schema is a common GraphQL idiom that refers to the person “viewing” the data, usually the currently logged-in user. For brevity, I’ve decided not to define the Image type.
The main event
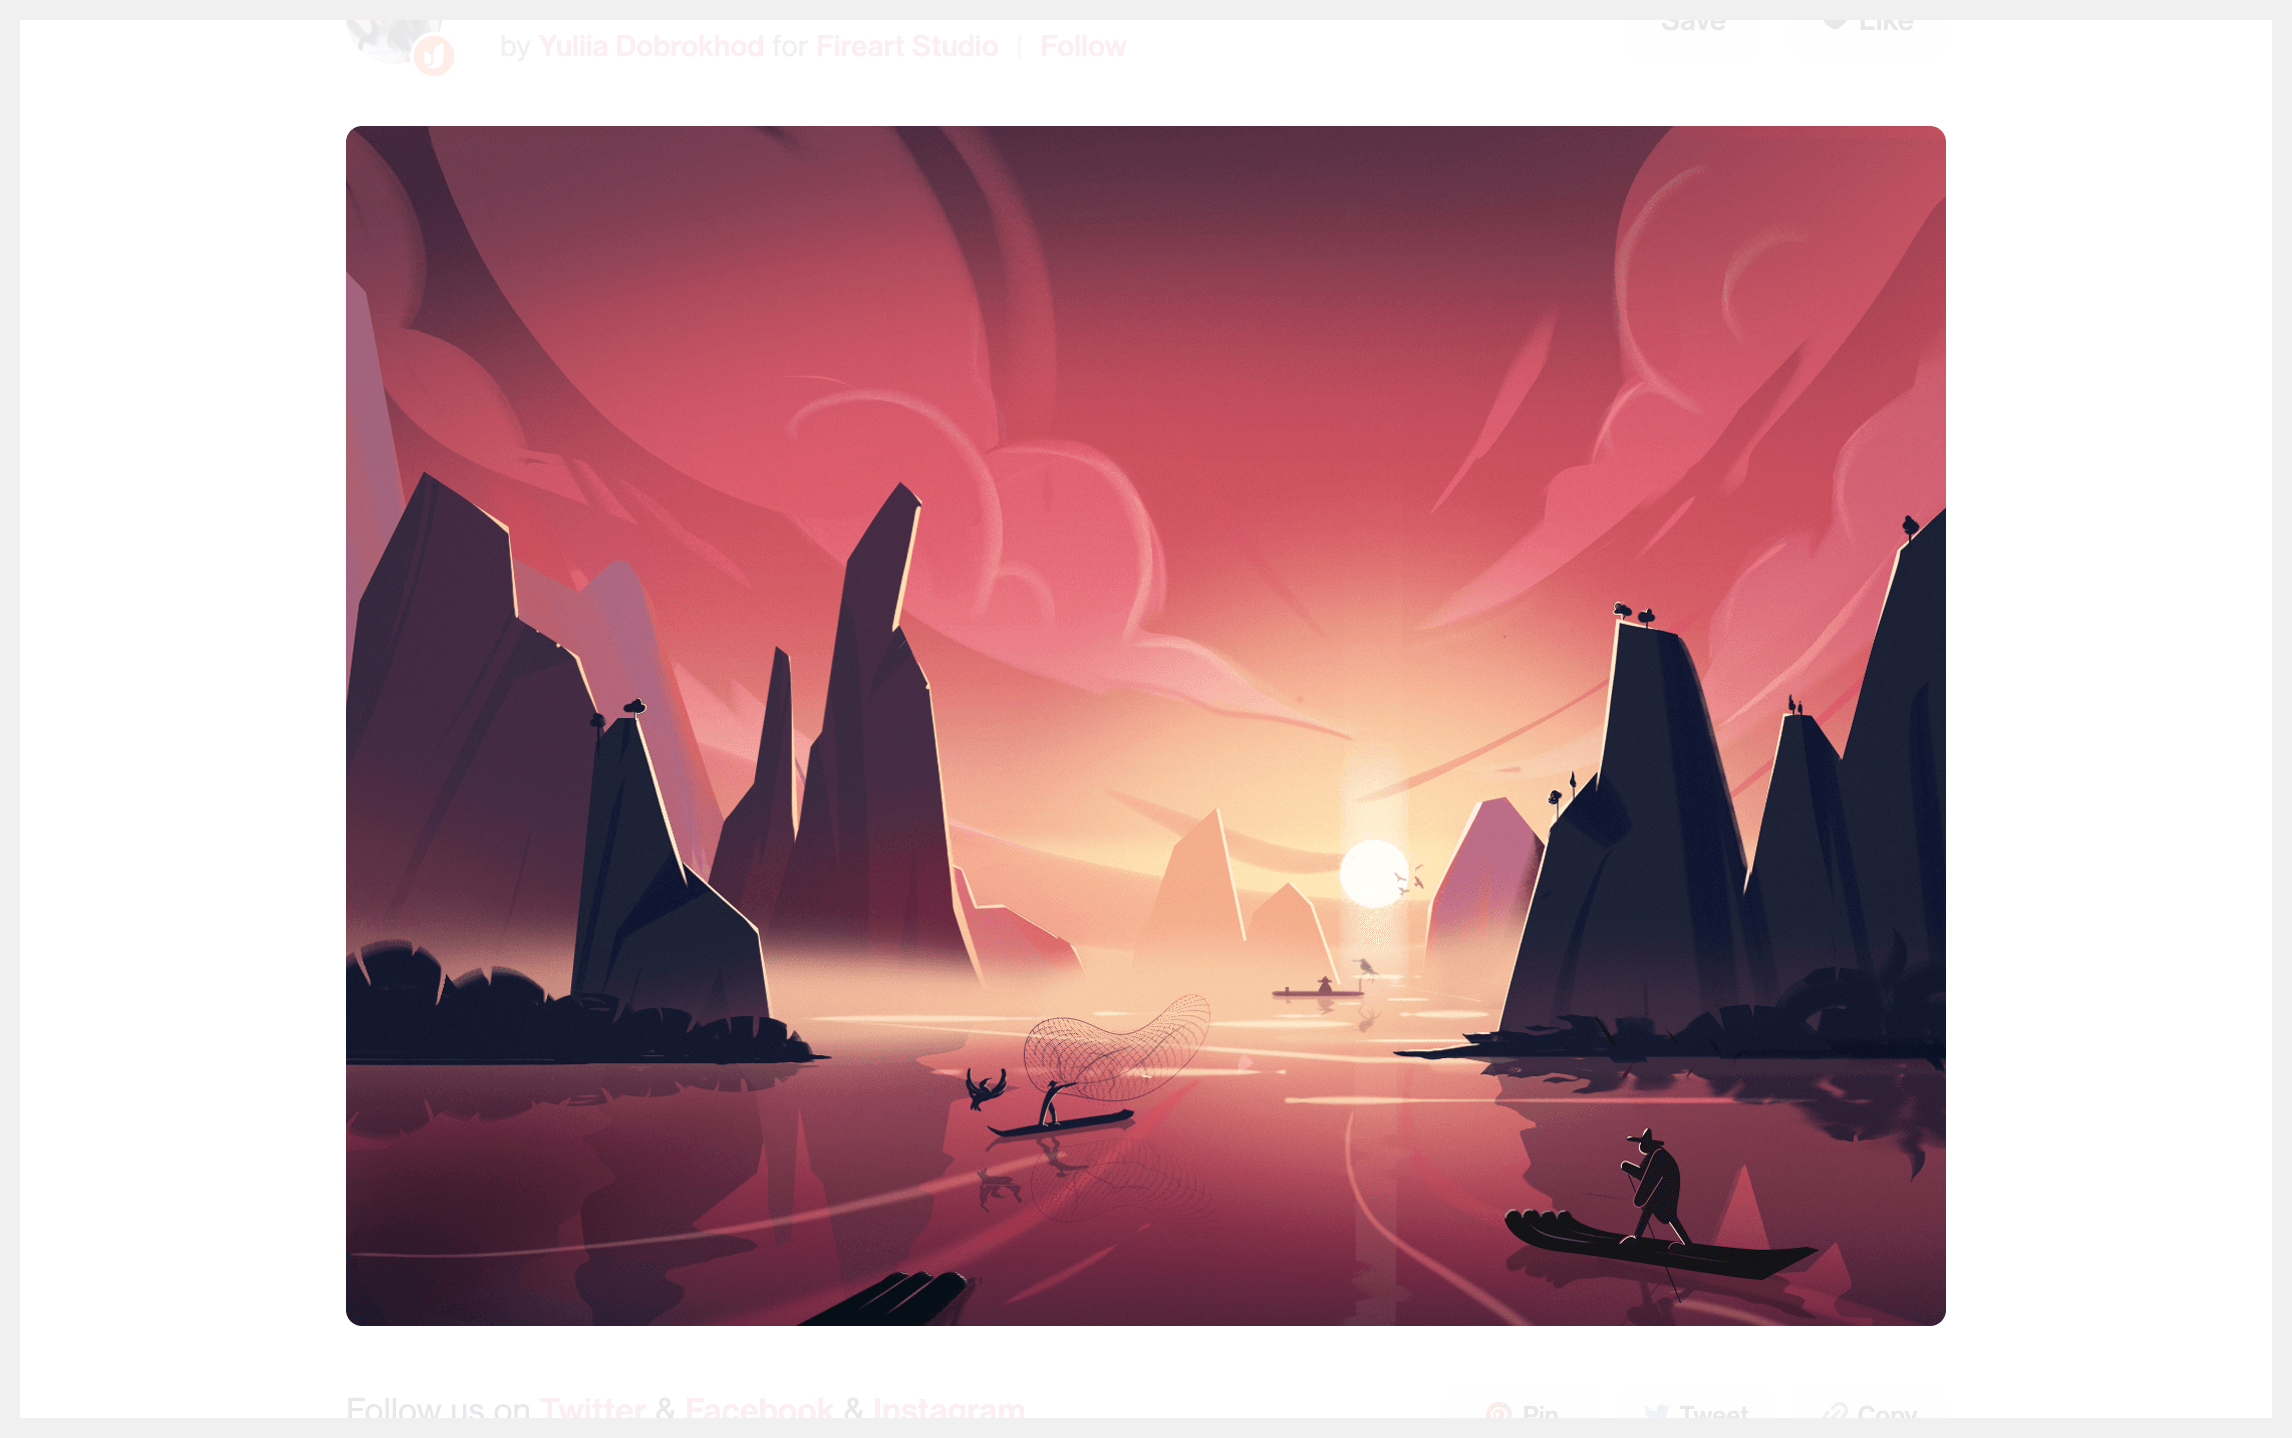
Let’s move onto the focus of the page, the shot image itself. There’s not a lot going on here, so it’s fairly simple.
# I'm using the type extension syntax (http://spec.graphql.org/June2018/#sec-Object-Extensions) for brevity
extend type Shot {
  image: Image!
}
Done. Well, kind of. I know from being familiar with Dribbble that there’s a bit more to it than this (such as GIFs and videos, and allowing multiple images), but it adds complexity that’s wise to skip on the first pass of the exercise.
The left column
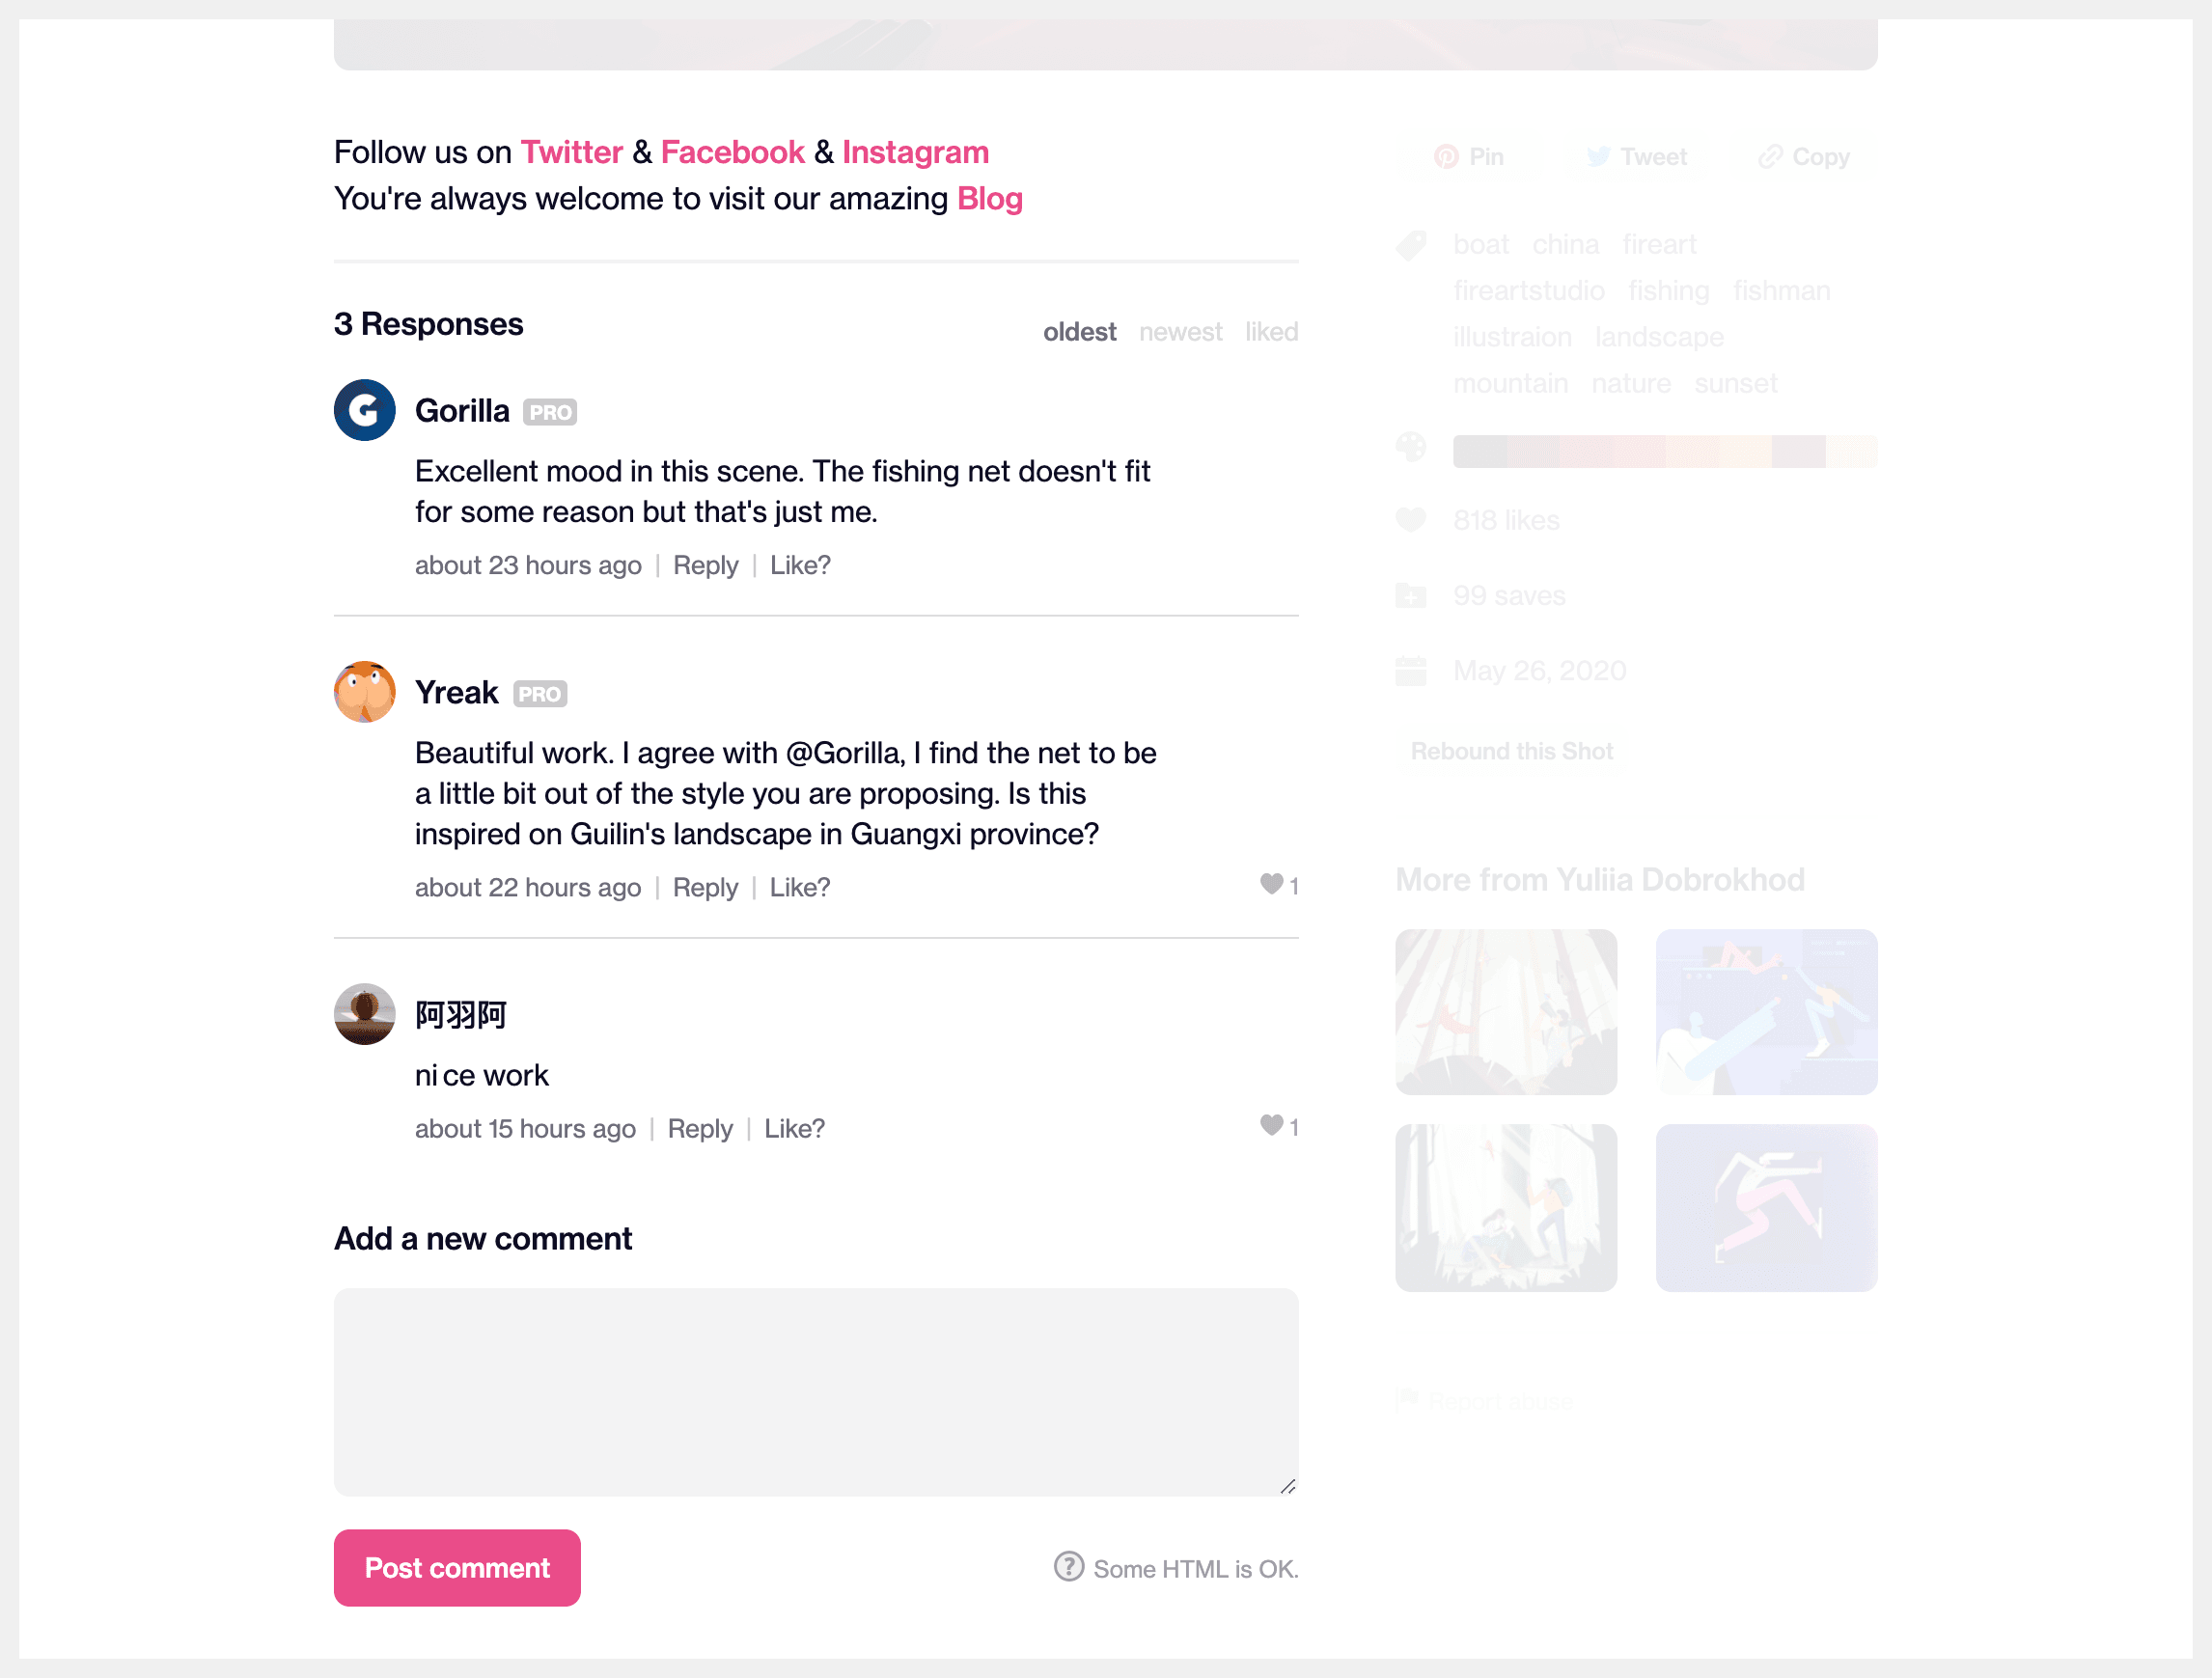
The first thing in the left column is the description of the shot; it supports some degree of formatting and there are lots of ways this could be represented in an API. Let’s assume there’s already an HTML type we can use.
extend type Shot {
  description: HTML!
}
The next part is the comments. Aside from the list of comments itself, we have a total comment count, as well as the ability to display them with different orderings. Looking at a single comment, we can see a few pieces of information:
The comment text
The author name, avatar and “pro” status
The comment timestamp
Whether the “viewer” has liked it or not
The number of likes (not shown in the picture is also the fact that you can click the number of likes to see the individual “likes”)
Let’s build out the Comment type.
extend type User {
  isPro: Boolean!
}

type Comment {
  id: ID!
  author: User!
  content: HTML!
  shot: Shot! # For completeness, not strictly needed
  submittedAt: DateTime!
  numLikes: Int!
  viewerHasLiked: Boolean!
  likedBy: UserConnection!
}
I’ve implemented the likedBy field as a GraphQL Connection rather than just as an array to support pagination. My reasoning here is that even though the number of likes for a single comment will usually be quite low (compared to likes on a Shot itself), it still essentially has no upper bound. This means we can’t assume we’ll be able to efficiently load them all at once, thus making pagination a requirement.
The most common oversight I see with this exercise is to not consider performance, so some mention of pagination is key. A related issue is that I often see people wanting to let the front-end do the work of calculating aggregate values like total counts (numLikes is an example here). Both issues are usually seen together. If someone sees the need for pagination, they don’t usually miss that it makes reliably calculating totals in the front-end impossible.
There’s potentially another missing capability here — if the system wants to treat a “like” as a first-class entity, then we might replace the likedBy connection with a likes one referring to some kind of Like type rather than User. I haven’t seen anywhere on Dribbble where likes are used as anything other than a join between users and shots (e.g no additional data such as timestamps), so I’ve opted to keep things simple.
Now we have a way of modelling comments, we can add them to shots
enum CommentOrdering {
  OLDEST_FIRST
  NEWEST_FIRST
  MOST_LIKED_FIRST
}

extend type Shot {
  numComments: Int!
  comments(orderBy: CommentOrdering = OLDEST_FIRST): CommentConnection!
}
I’ve added an ordering parameter to the comments connection to support the three different choices we can see in the UI.
The right column
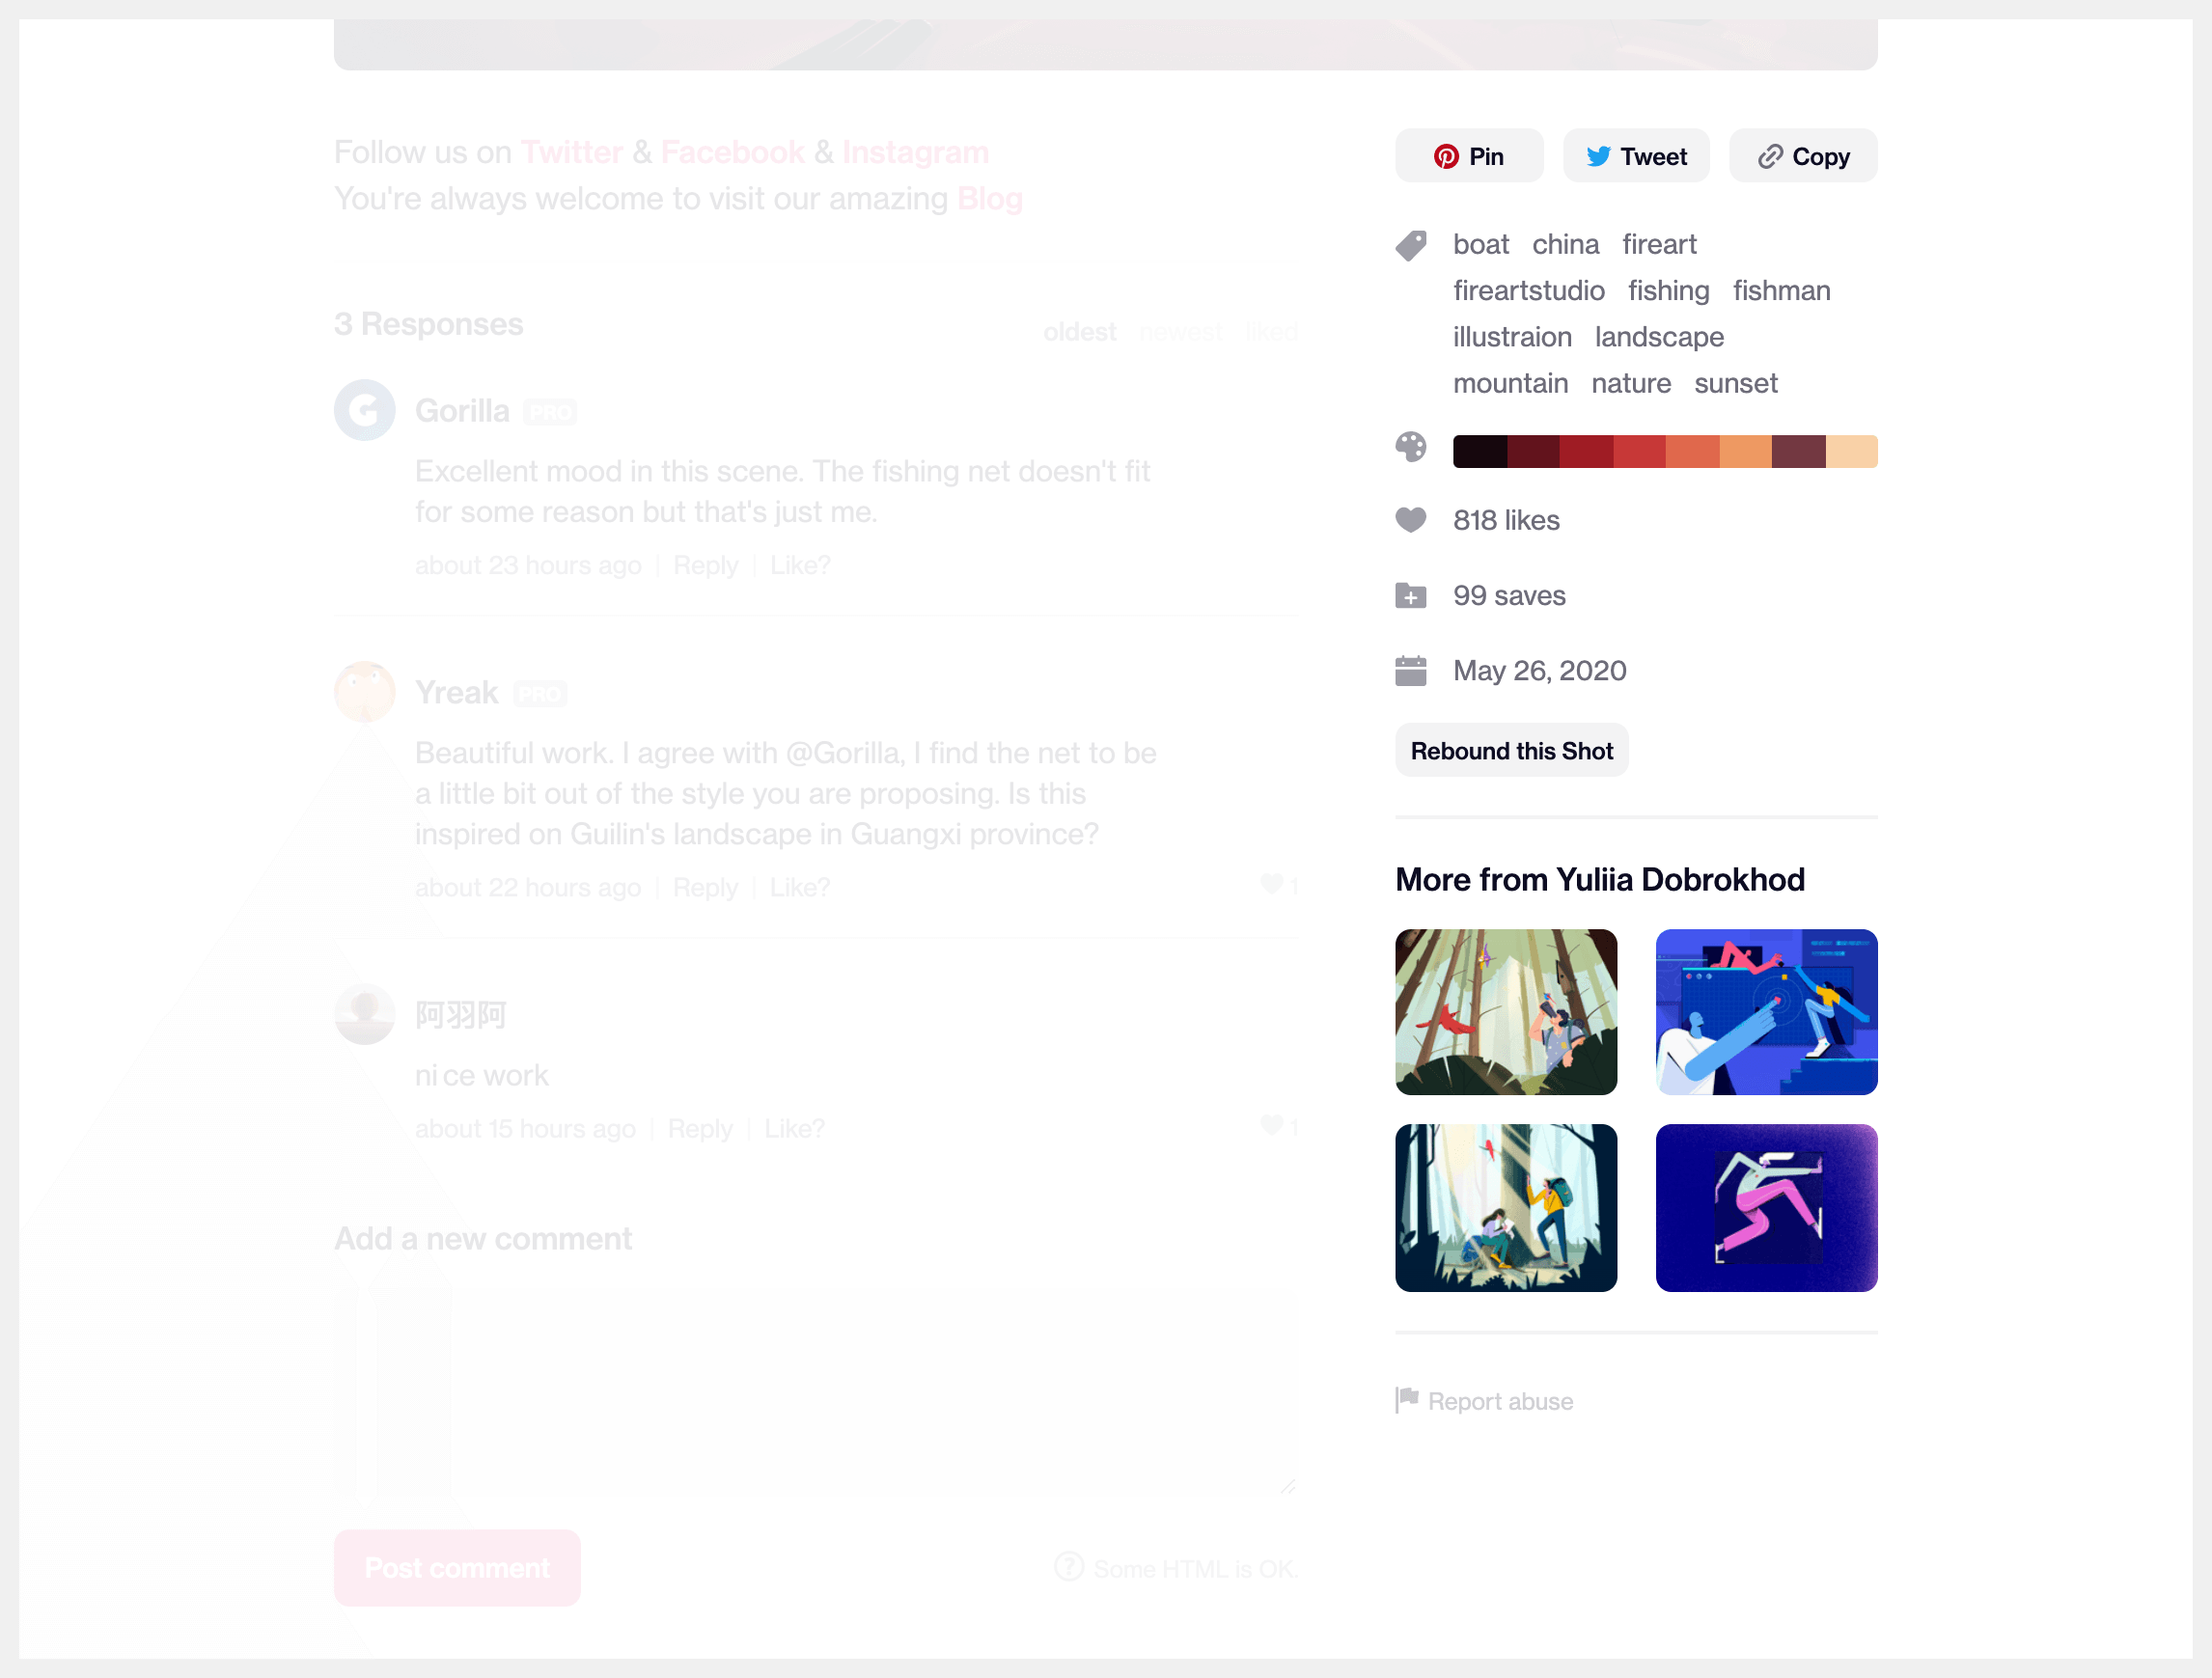
Nearly everything we can see here is related to the Shot itself, and there are quite a few new pieces of information:
Tags
Extracted colour palette
Number of likes (not visible is that it clicks through to a page showing a list of all the liking users)
Number of saves (also a link to a page showing which collections the shot has been saved in)
Timestamp posted
A selection of up to 4 other shots by the same creator
extend type Shot {
  tags: [Tag!]!
  colors: [Color!]!
  numLikes: Int!
  numSaves: Int!
  likedBy: UserConnection!
  savedIn: CollectionConnection!
  postedAt: DateTime!
}

extend type User {
  shots(exclude: ID): ShotConnection!
}
I haven’t defined Tag and Color here, but they could either just be simple scalar string values, or implemented as richer data structures. I’ve chosen not to define what Collections look like because they’re not part of this page. For the shots field on User, I’ve allowed an ID to be excluded so that we don’t show the shot we’re already looking at, but there are several ways we could solve this problem.
Wrapping it up
We’ve reached the bottom of the page and covered most pieces of data we can see. If I were giving this exercise in an interview, I wouldn’t expect a good candidate to get everything, and I certainly wouldn’t expect them to make the same assumptions and decisions as me. But I do think this is a valuable skill worth testing for, and this exercise is a lot more fun than asking people to solve an unfamiliar recursion problem on a whiteboard. If a candidate gets through it quickly, you can ask follow-up questions (performance ones are good), or click through to another page and see how the model can be refined or expanded.
This is just one of many ways to test for data modelling skills. For backend developers, there are other exercises you can use. However, when assessing front-end or API-oriented developers, this can be a great exercise to incorporate into your interview process.
Thoughts on Next 13 - Dynamic with some limits
I’ve been trying out the pre-release version of Next 13 (and by association, React 18.3) for the last couple of months, specifically the parts related to the new router and server components. I suspec…
Demystifying GraphQL Connections
If you’ve used GraphQL for a while, it’s likely come across its (formally Relay’s) Connection Specification whether you’ve used it or not. It’s a pattern for implementing cursor-based pagination in Gr…